Apply dictionary to specific contexts
We can detect occurrences of words in specific contexts by selectively applying dictionary. In this example, we will apply a sentiment dictionary to segments of news articles that mentions the (British) government.
require(quanteda)
require(quanteda.corpora)
This corpus contains 6,000 Guardian news articles from 2012 to 2016.
corp_news <- download("data_corpus_guardian")
Tokenize texts and select tokens surrounding keywords related to the government using tokens_keep().
# tokenize corpus
toks_news <- tokens(corp_news, remove_punct = TRUE)

# get relevant keywords and phrases
gov <- c("government", "cabinet", "prime minister")

# only keep tokens specified above and their context of ±10 tokens
# note: use phrase() to correctly score multi-word expressions
toks_gov <- tokens_keep(toks_news, pattern = phrase(gov), window = 10)
Apply the Lexicoder Sentiment Dictionary to the selected contexts using tokens_lookup().
lengths(data_dictionary_LSD2015)
##     negative     positive neg_positive neg_negative
##         2858         1709         1721         2860
# select only the "negative" and "positive" categories
data_dictionary_LSD2015_pos_neg <- data_dictionary_LSD2015[1:2]
toks_gov_lsd <- tokens_lookup(toks_gov, dictionary = data_dictionary_LSD2015_pos_neg)
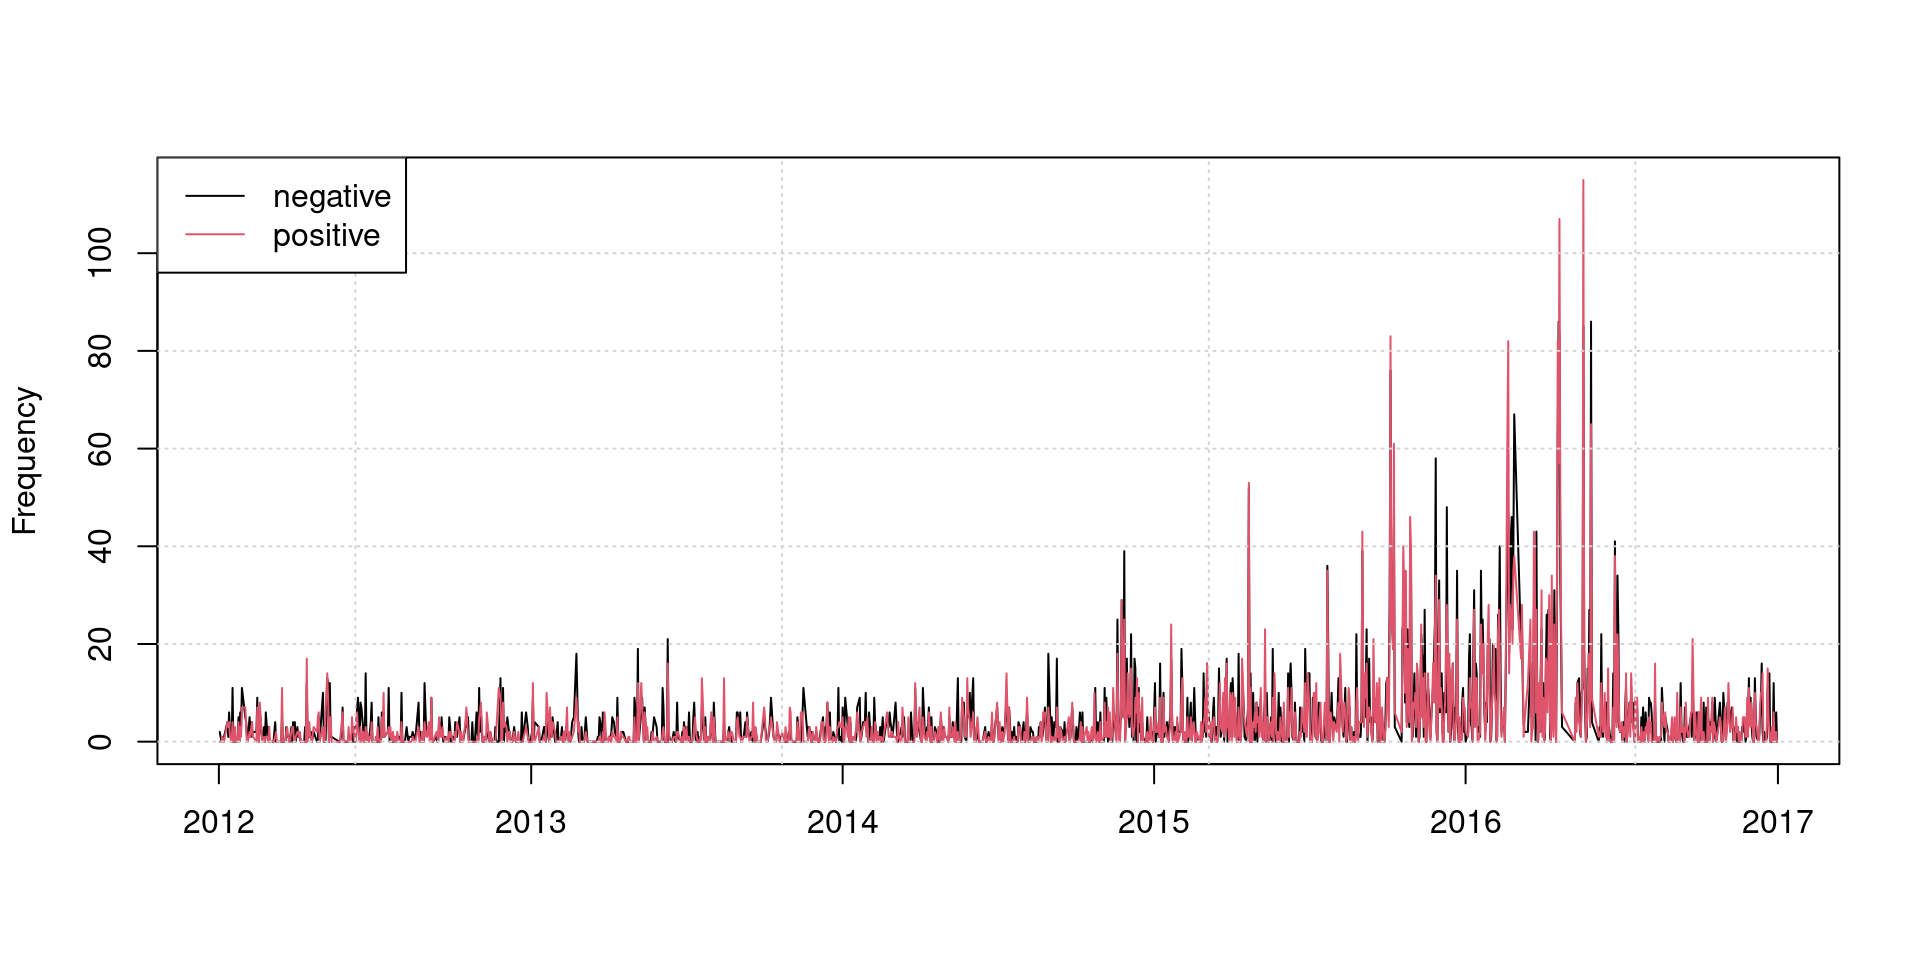
# create a document document-feature matrix and group it by day
dfmat_gov_lsd <- dfm(toks_gov_lsd) %>%
dfm_group(groups = date)
matplot(dfmat_gov_lsd$date, dfmat_gov_lsd, type = "l", lty = 1, col = 1:2,
        ylab = "Frequency", xlab = "")
grid()
legend("topleft", col = 1:2, legend = colnames(dfmat_gov_lsd), lty = 1, bg = "white")
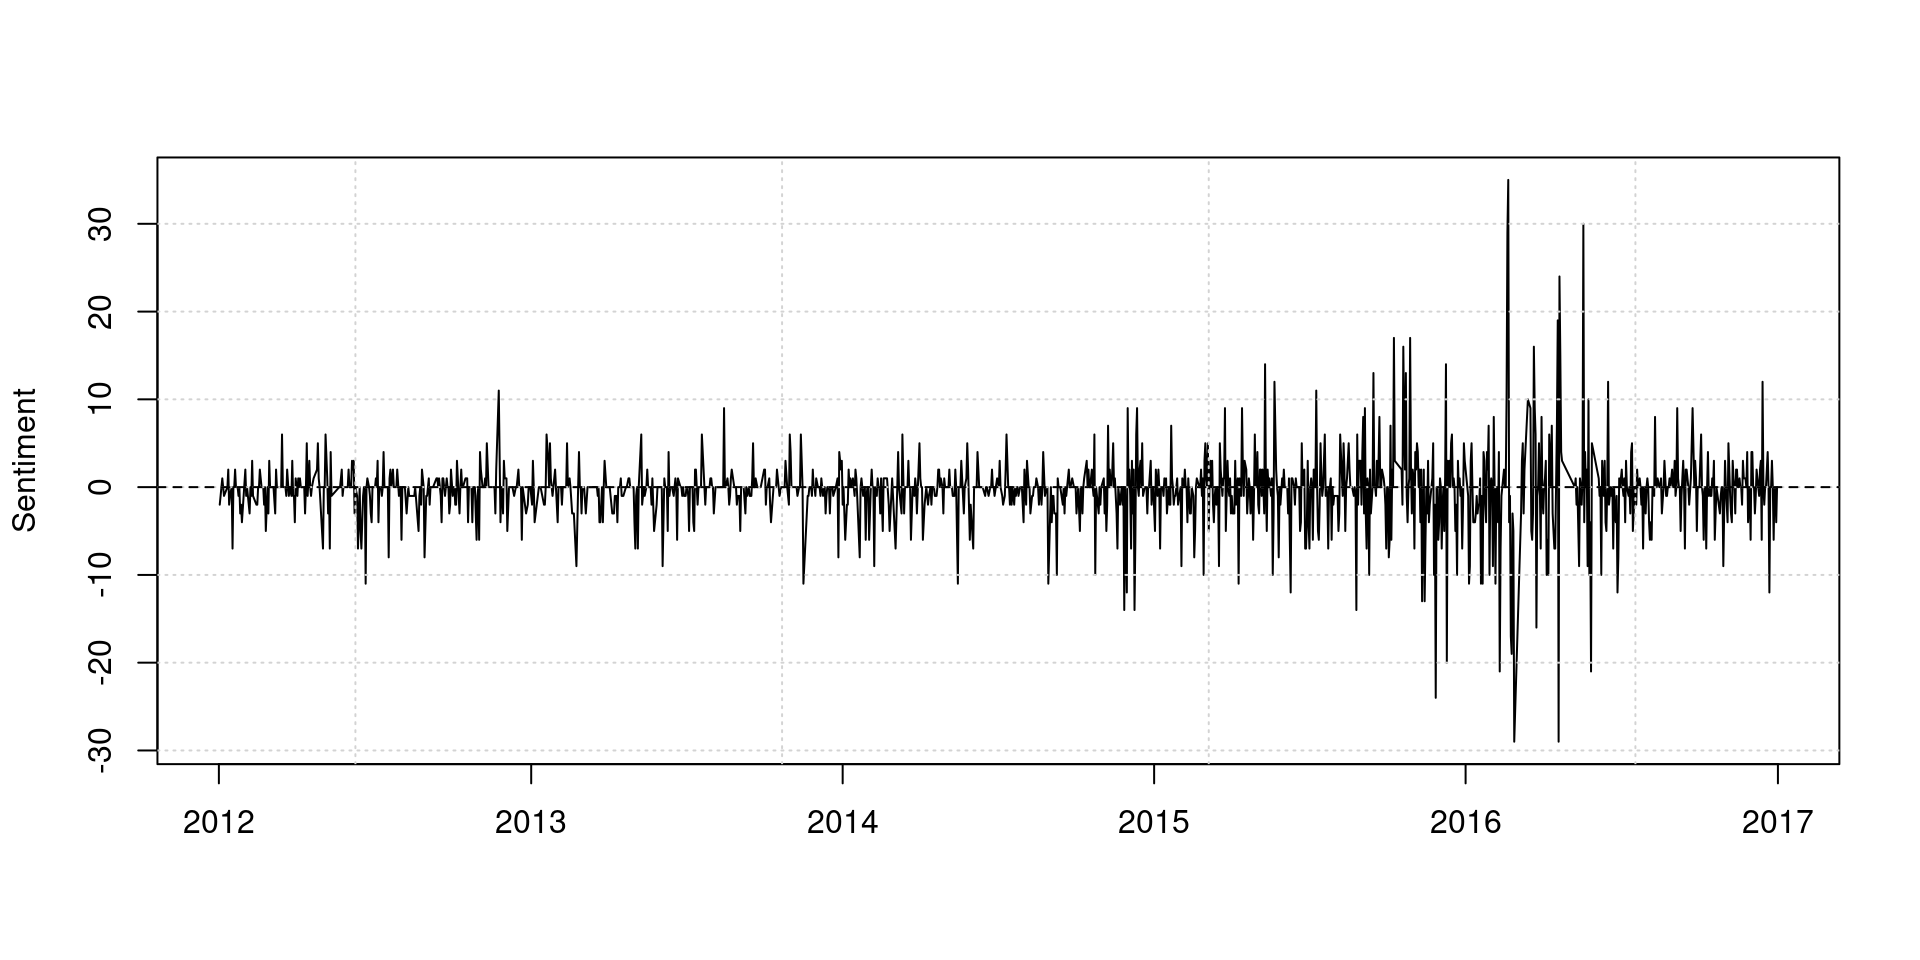
We can compute daily sentiment scores by taking the difference between the frequency of positive and negative words.
plot(dfmat_gov_lsd$date, dfmat_gov_lsd[,"positive"] - dfmat_gov_lsd[,"negative"],
     type = "l", ylab = "Sentiment", xlab = "")
grid()
abline(h = 0, lty = 2)
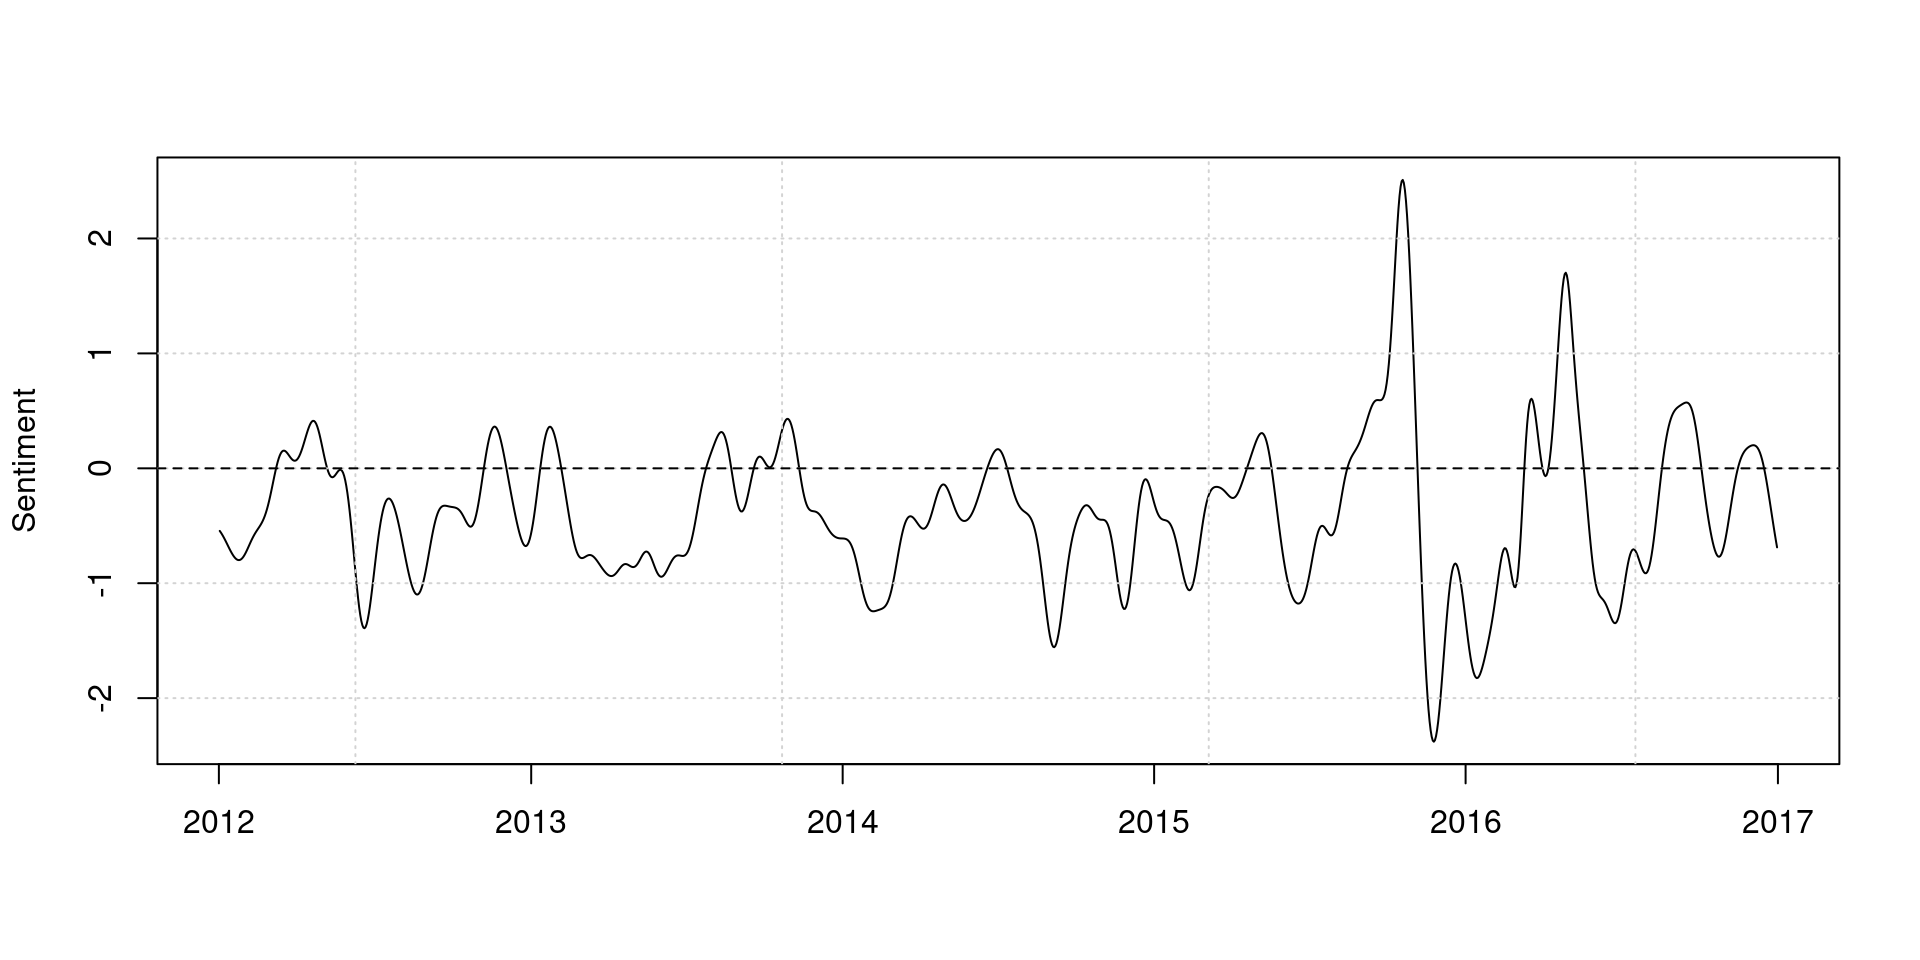
We can apply kernel smoothing to show the trend more clearly.
dat_smooth <- ksmooth(x = dfmat_gov_lsd$date,
                      y = dfmat_gov_lsd[,"positive"] - dfmat_gov_lsd[,"negative"],
                      kernel = "normal", bandwidth = 30)
plot(dat_smooth$x, dat_smooth$y, type = "l", ylab = "Sentiment", xlab = "")
grid()
abline(h = 0, lty = 2)