Wordfish
Wordfish is a Poisson scaling model of one-dimensional document positions (Slapin and Proksch 2008). Wordfish also allows for scaling documents, but in comparison to Wordscores, reference scores/texts are not required. Wordfish is an unsupervised one-dimensional text scaling method, meaning that it estimates the positions of documents solely based on the observed word frequencies.
require(quanteda)
require(quanteda.textmodels)
require(quanteda.textplots)
In this example, we will show how to apply Wordfish to the Irish budget speeches from 2010. First, we will create a document-feature matrix. Afterwards, we will run Wordfish.
toks_irish <- tokens(data_corpus_irishbudget2010, remove_punct = TRUE)
dfmat_irish <- dfm(toks_irish)
tmod_wf <- textmodel_wordfish(dfmat_irish, dir = c(6, 5))
summary(tmod_wf)
##
## Call:
## textmodel_wordfish.dfm(x = dfmat_irish, dir = c(6, 5))
##
## Estimated Document Positions:
##                              theta      se
## Lenihan, Brian (FF)        1.79395 0.02007
## Bruton, Richard (FG)      -0.62137 0.02824
## Burton, Joan (LAB)        -1.13501 0.01568
## Morgan, Arthur (SF)       -0.07840 0.02896
## Cowen, Brian (FF)          1.77839 0.02330
## Kenny, Enda (FG)          -0.75343 0.02635
## ODonnell, Kieran (FG)     -0.47615 0.04309
## Gilmore, Eamon (LAB)      -0.58474 0.02992
## Higgins, Michael (LAB)    -1.00390 0.03964
## Quinn, Ruairi (LAB)       -0.92648 0.04183
## Gormley, John (Green)      1.18354 0.07224
## Ryan, Eamon (Green)        0.14816 0.06322
## Cuffe, Ciaran (Green)      0.71537 0.07291
## OCaolain, Caoimhghin (SF) -0.03993 0.03877
##
## Estimated Feature Scores:
##         when      i presented    the supplementary  budget     to   this  house
## beta -0.1593 0.3179    0.3604 0.1934         1.077 0.03546 0.3078 0.2474 0.1399
## psi   1.6241 2.7239   -1.7958 5.3308        -1.134 2.70992 4.5190 3.4603 1.0396
##        last   april    said     we   could   work    our    way through  period
## beta 0.2420 -0.1563 -0.8339 0.4158 -0.6138 0.5223 0.6894 0.2751  0.6116  0.4986
## psi  0.9853 -0.5725 -0.4515 3.5124  1.0857 1.1151 2.5277 1.4190  1.1604 -0.1779
##          of severe economic distress   today    can  report   that
## beta 0.2778  1.229   0.4238    1.799 0.09153 0.3041  0.6199 0.0152
## psi  4.4656 -2.013   1.5714   -4.456 0.83874 1.5644 -0.2467 3.8379
##      notwithstanding difficulties   past
## beta           1.799        1.175 0.4747
## psi           -4.456       -1.357 0.9321
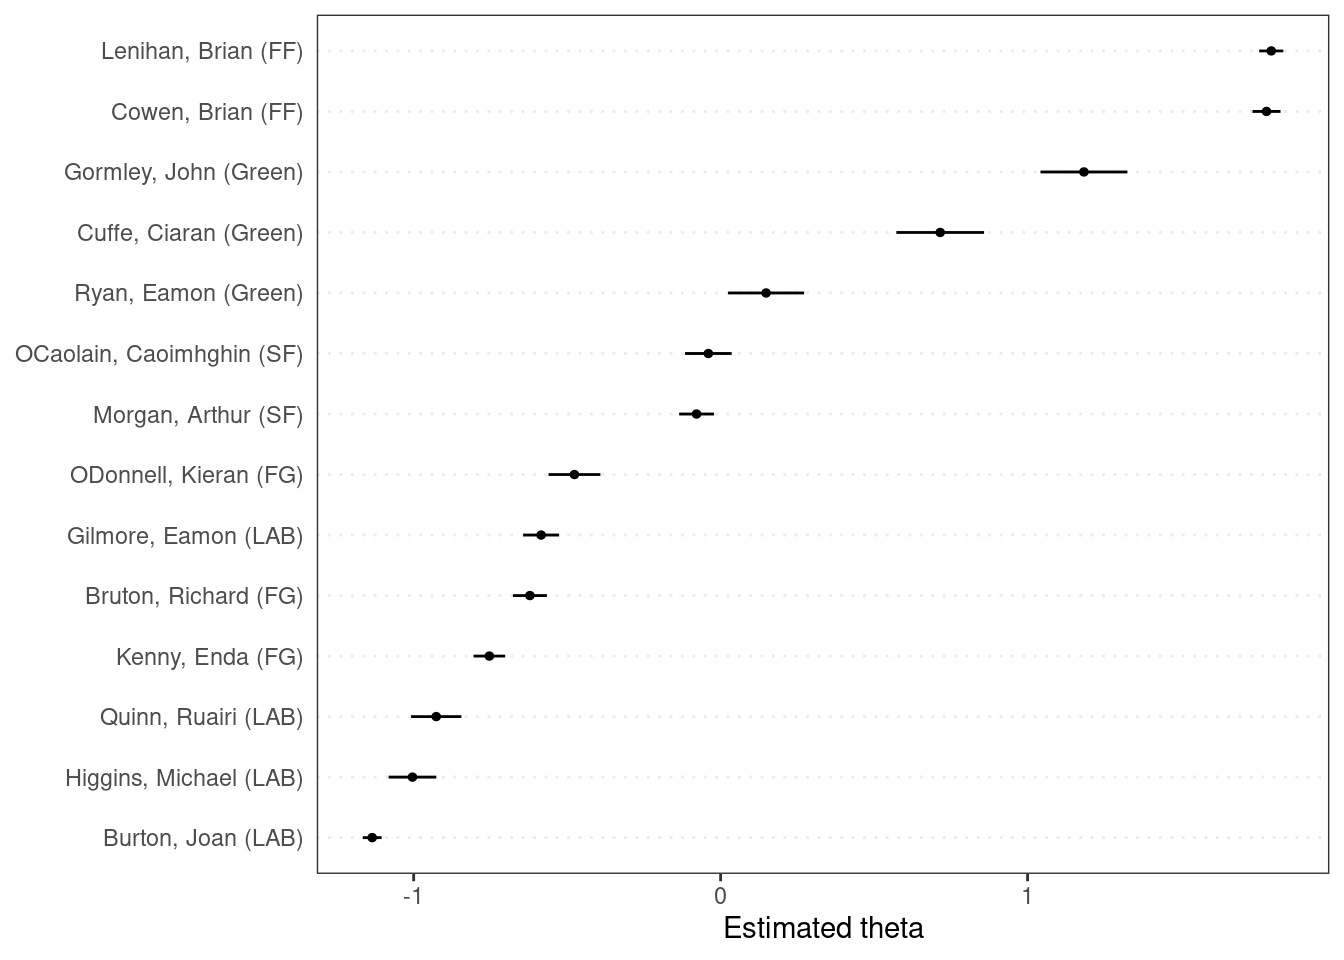
We can plot the results of a fitted scaling model using textplot_scale1d().
textplot_scale1d(tmod_wf)
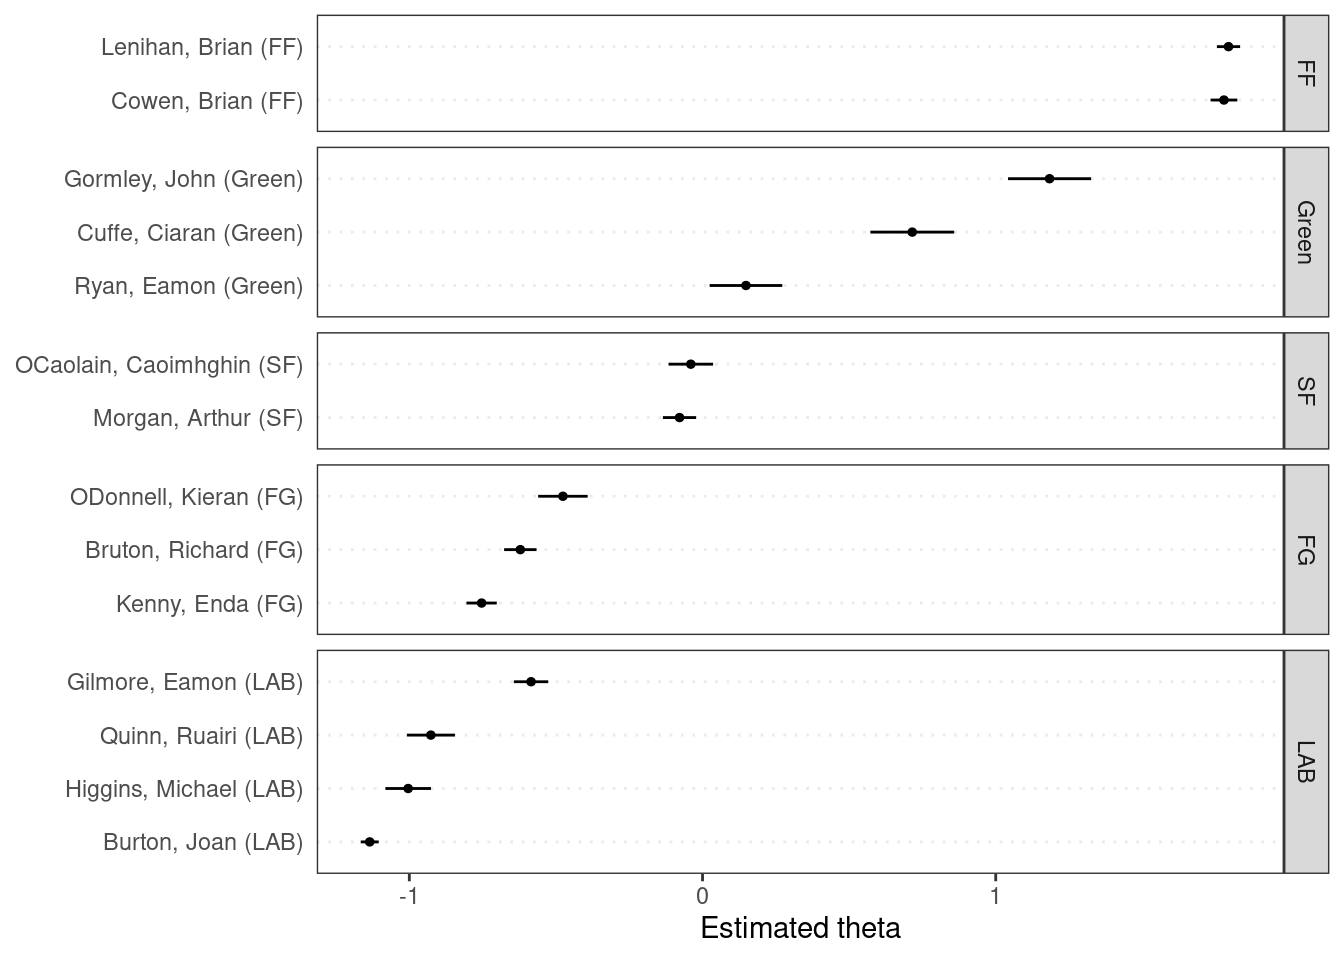
The function also allows you to plot scores by a grouping variable, in this case the party affiliation of the speakers.
textplot_scale1d(tmod_wf, groups = dfmat_irish$party)
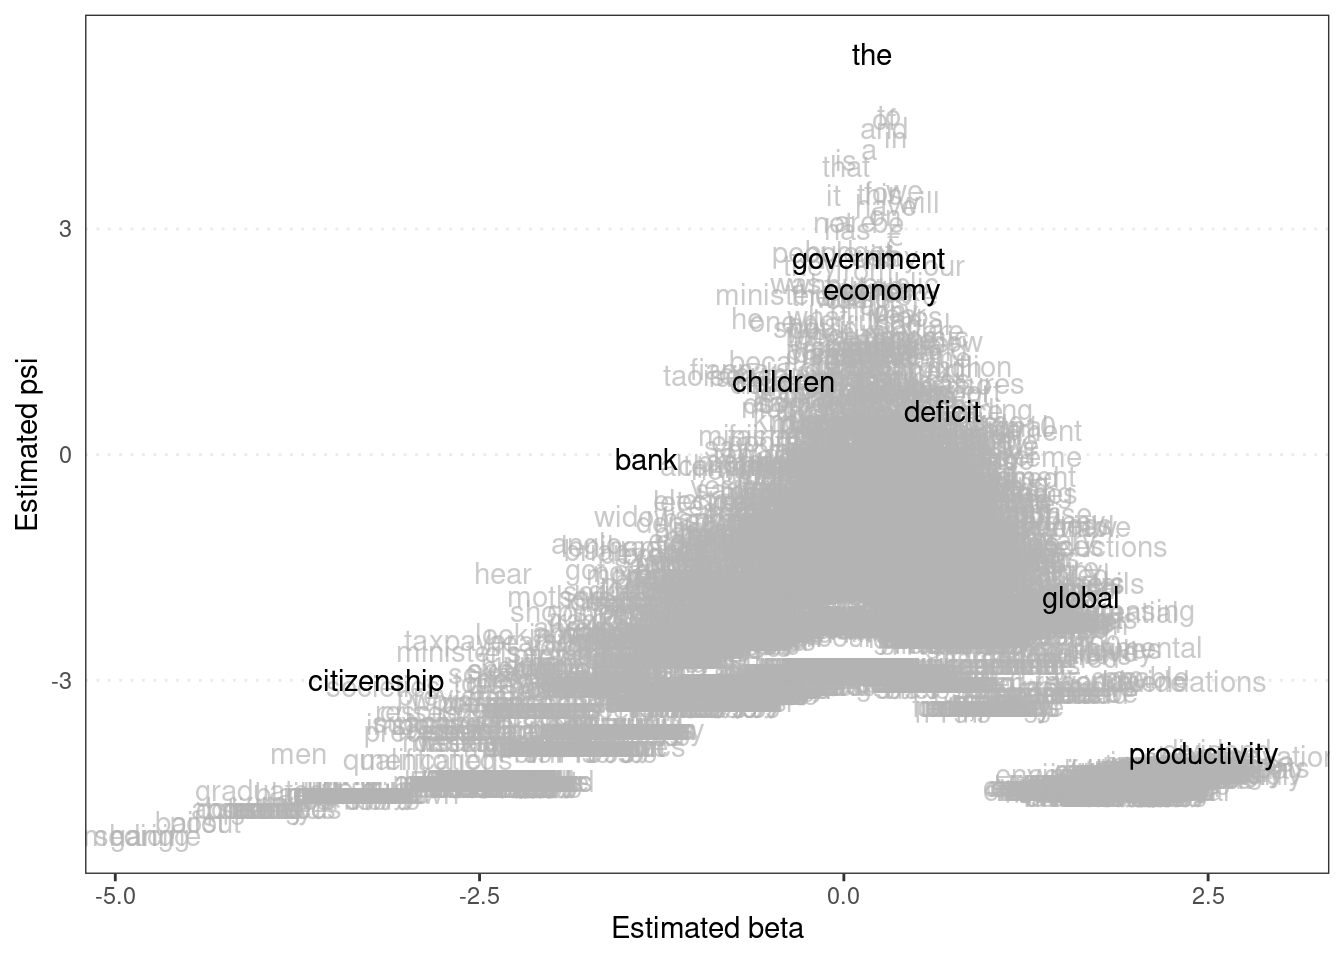
Finally, we can plot the estimated word positions and highlight certain features.
textplot_scale1d(tmod_wf, margin = "features",
                 highlighted = c("government", "global", "children",
                                 "bank", "economy", "the", "citizenship",
                                 "productivity", "deficit"))
- Slapin, Jonathan and Sven-Oliver Proksch. 2008. “A Scaling Model for Estimating Time-Series Party Positions from Texts.” American Journal of Political Science 52(3): 705-772.