Correspondence analysis
Correspondence analysis is a technique to scale documents on multiple dimensions. Correspondence analysis is similar to principal component analysis but works for categorical variables (contingency table).
require(quanteda)
require(quanteda.textmodels)
require(quanteda.textplots)
textmodel_ca() provides similar functionality to the ca package, but quanteda‘s version is more efficient for textual data.
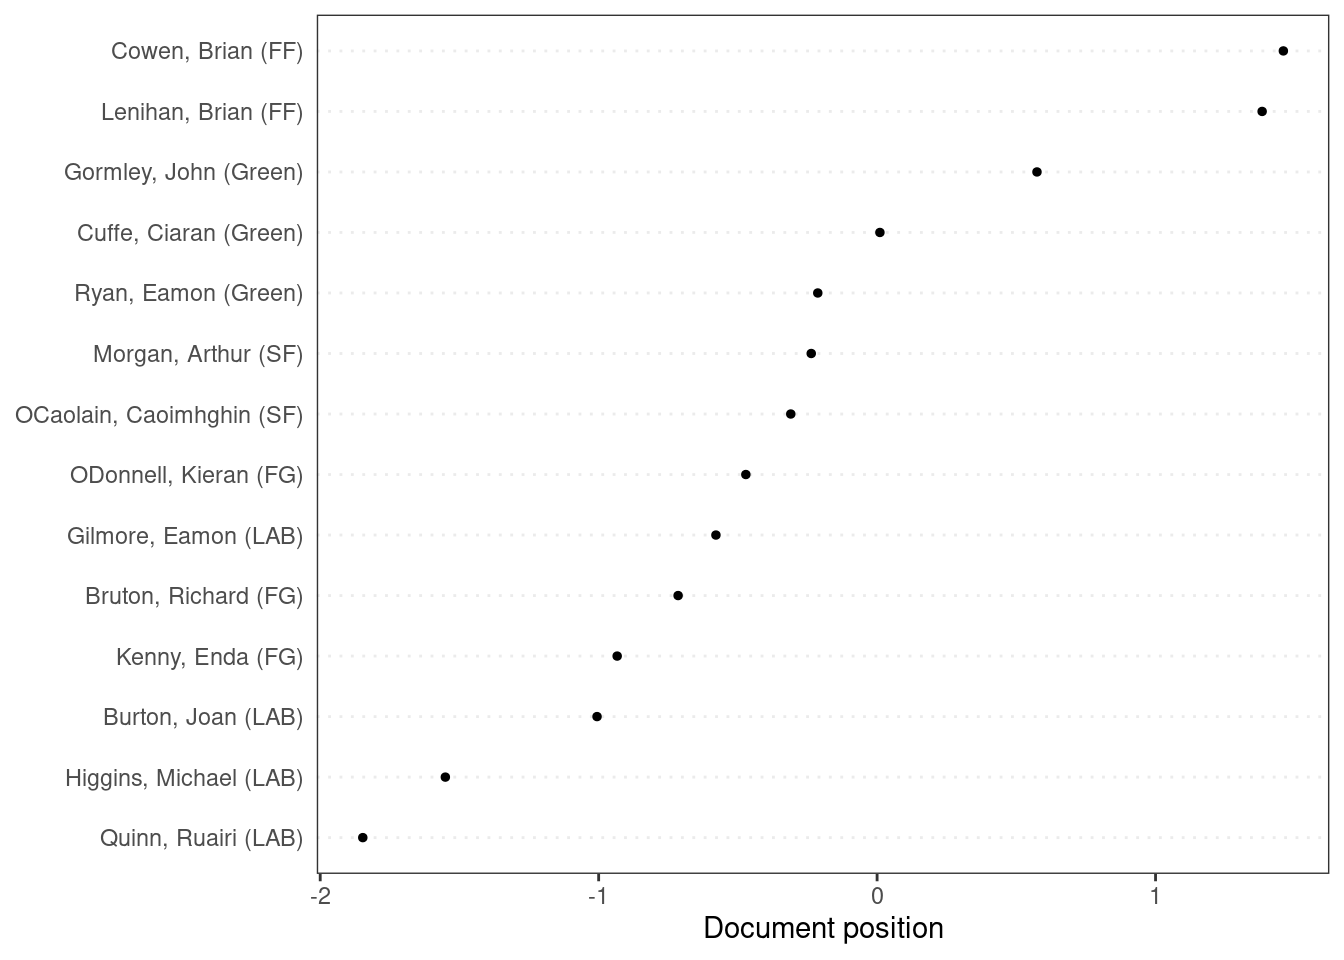
You can plot positions of documents on a one-dimensional scale using textplot_scale1d().
toks_irish <- tokens(data_corpus_irishbudget2010, remove_punct = TRUE)
dfmat_irish <- dfm(toks_irish) %>%
               dfm_remove(pattern = stopwords("en"))

tmod_ca <- textmodel_ca(dfmat_irish)
textplot_scale1d(tmod_ca)
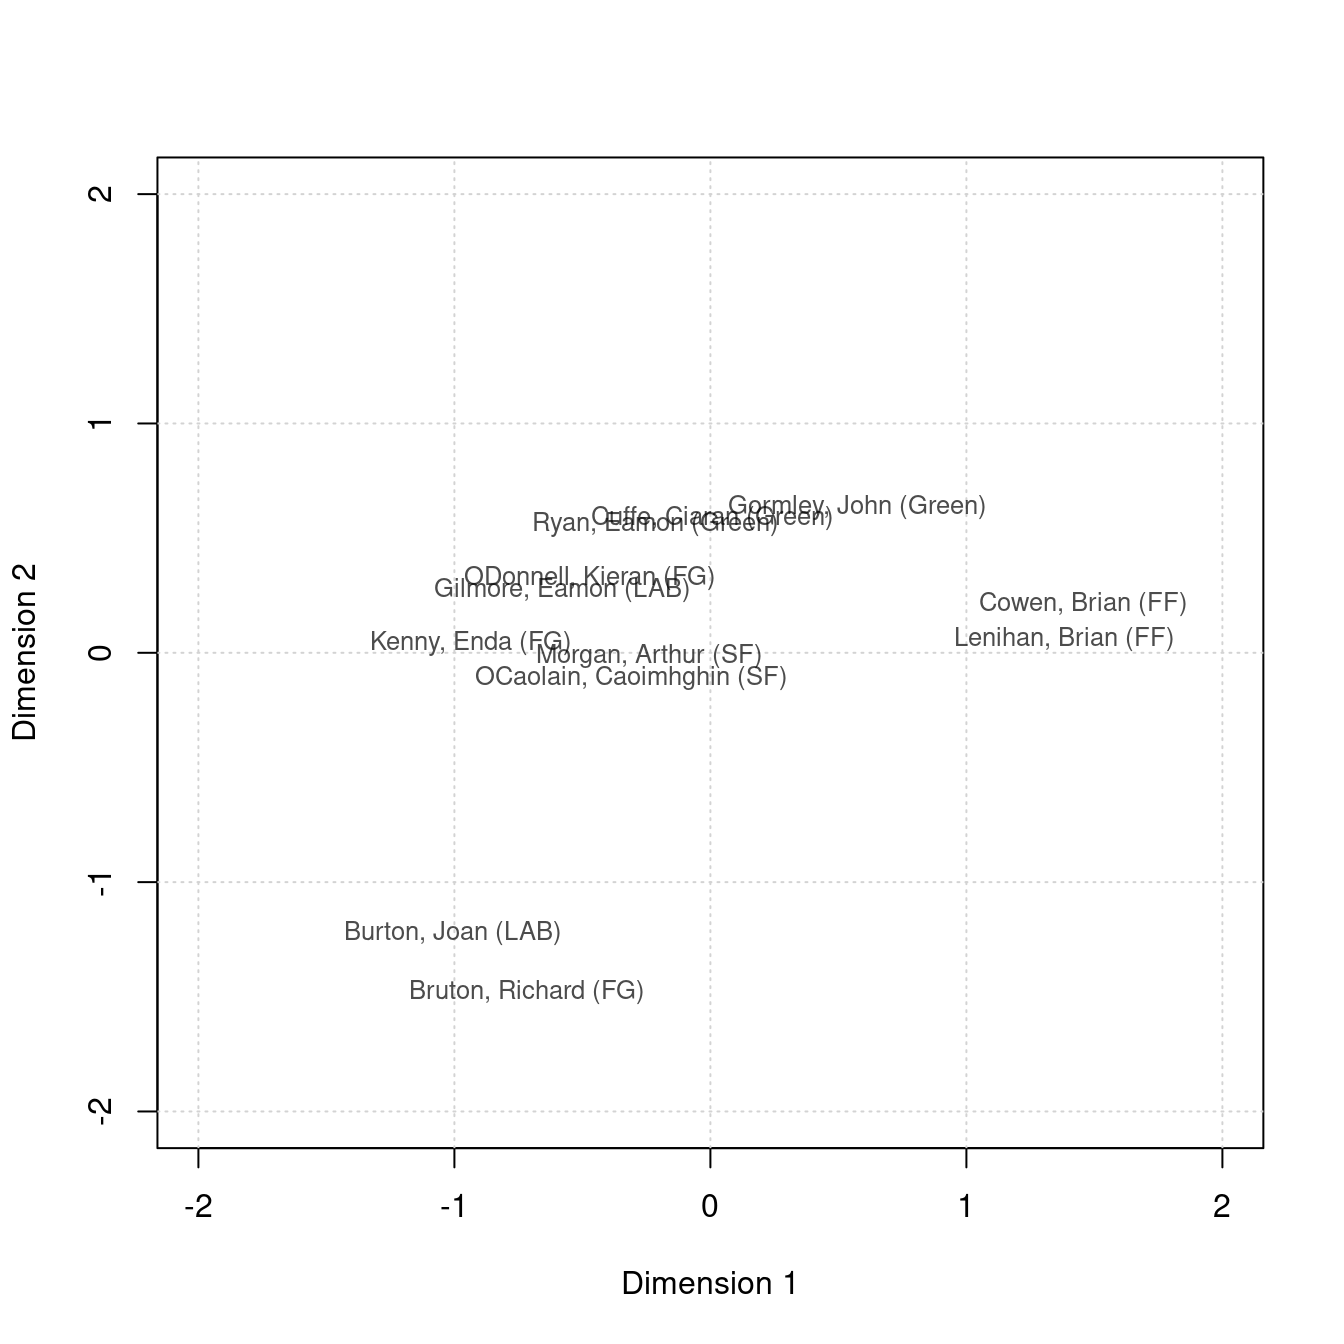
If you want to plot documents on multi-dimensional scale, you can use coef() to obtain coordinates of lower dimensions.
dat_ca <- data.frame(dim1 = coef(tmod_ca, doc_dim = 1)$coef_document,
                     dim2 = coef(tmod_ca, doc_dim = 2)$coef_document)
head(dat_ca)
##                            dim1        dim2
## Lenihan, Brian (FF)   1.3828058  0.05765853
## Bruton, Richard (FG) -0.7146625 -1.48053878
## Burton, Joan (LAB)   -1.0058287 -1.22454364
## Morgan, Arthur (SF)  -0.2365214 -0.01424761
## Cowen, Brian (FF)     1.4590326  0.21164169
## Kenny, Enda (FG)     -0.9335150  0.03923246
plot(1, xlim = c(-2, 2), ylim = c(-2, 2), type = "n", xlab = "Dimension 1", ylab = "Dimension 2")
grid()
text(dat_ca$dim1, dat_ca$dim2, labels = rownames(dat_ca), cex = 0.8, col = rgb(0, 0, 0, 0.7))